Correction / Metal & the Neural Engine
8.75:1 hysteresis puts fan stop at 27°C
mac-tool-kit's 7.8°C hysteresis band splits 8.75:1, placing the fan stop at 27.0°C — a temperature inference or DSP sessions never return to mid-session.

Joshua HriskoPrincipal Engineer
6 min readSan Francisco, CA

Composed from the signals scanned on 2026-08-29.
The hysteresis band in mac-tool-kit’s closed-loop controller is 7.8°C total but split 8.75:1 between the spin-down guard and the ramp-up threshold — not the symmetric anti-hunting window the README implies. At the documented palm rest target of 34°C, that asymmetry places the fan stop condition at a derived 27.0°C, a value any sustained inference or DSP session holds the chassis above indefinitely.
Stated figures and their conditions
The README reports three monitoring profiles, two thermal thresholds, a cost figure, and a collection of AI session telemetry claims. Conditions are sparse throughout.
| Claim | Stated value | Conditions the README attaches |
|---|---|---|
| Real-time (1s) CPU overhead | ~2–4% | None: hardware, process count, container count unstated |
| Balanced (3s) CPU overhead | ~0.5–1% | None: same conditions unstated |
| Eco fan-only CPU overhead | <0.05% | Process scans and Docker CLI suspended; thermal loop retained |
| Fan ramp-up threshold | ≥ Target + 0.8°C | Closed-loop mode; active sensor unspecified |
| Fan spin-down threshold | < Target − 7.0°C | Closed-loop mode; active sensor unspecified |
| Palm Rest Balanced Cooling target | ≤ 34°C | Palm Rest & Battery sensor explicitly named |
| Manual RPM range | 1,200–6,200 RPM | SMC root helper required |
| Prompt Cache Read cost reduction | 90% | Parenthetical descriptor; source not attributed in README |
The README states compatibility with Apple Silicon and macOS SMC root helper protocol but does not specify which Apple Silicon generations expose a controllable fan via SMC.
Analysis
Hysteresis geometry and the 34°C case
The README describes the control logic as an “industrial -7°C thermal hysteresis anti-hunting algorithm.” Define as the user-selected target temperature. The README gives two explicit thresholds:
The ratio of the spin-down guard to the ramp-up threshold:
For the palm rest comfort scenario the README describes explicitly, with :
A 27.0°C chassis surface under active compute is effectively idle — not a temperature a running system touches mid-session. The README correctly frames this asymmetry as preventing rapid start-stop cycling, and for short thermal spikes that framing holds: a brief compilation burst, a single LLM turn. For sustained workloads the chassis simply never returns to between tasks. The fan runs continuously, cycling suppression has no practical effect within the session, and the hysteresis governs only the delay before the single stop event at session end.
A symmetric 3.9°C guard on each side of target would preserve the same 7.8°C total separation while placing the stop condition at 30.1°C rather than 27.0°C — meaningfully more reachable during light pauses in a development session. “Anti-hunting” is technically accurate, but 8.75:1 exceeds what hunting suppression actually requires by a wide margin.
CPU overhead and process-scan cost attribution
The three overhead figures allow a bounded cost decomposition. Taking the midpoints of the stated ranges — 3% for Real-time, 0.75% for Balanced — and treating the <0.05% Eco ceiling as a proxy for the thermal-loop-only cost:
The cost ratio across the 3× interval change:
A 3× interval extension yields roughly 4.2× CPU reduction in the process-scan component. That is mildly super-linear relative to the interval ratio, consistent with Docker CLI polling being a fork-exec path: per-invocation startup cost is amortized over fewer calls at 3s, producing a slightly larger-than-proportional saving. The thermal regulation loop itself contributes less than 0.05% across all three modes — less than one-fifteenth of the Balanced profile’s total.
The “90% savings” attribution
The README states “Prompt Cache Read (90% savings)” as a parenthetical when listing token types, without identifying the figure’s source. It matches Anthropic’s published pricing discount for cache-read tokens. MacDashboard reads token counts from Claude Code’s usage logs and applies a cost formula; the discount is the LLM provider’s, not the tool’s. The README’s presentation conflates display of savings with generation of savings. An engineer estimating ROI from workflow changes versus from adopting MacDashboard needs that distinction explicit.
Connection to measured local inference loads
The README lists Ollama and local LLM monitoring as a first-class use case. Our M3 Ultra decode benchmarks measured sustained throughput at 9.8–139 tok/s across several models on the same Apple Silicon class the README targets. Those sessions are precisely the workloads most likely to trigger palm rest fan mode and then hold the chassis above for the session’s duration. The Real-time monitoring overhead of ~2–4% lands on top of inference compute, but the README states no conditions — no hardware, no inference load, no concurrent process count — so those figures cannot be directly summed with our measurements without assuming the configurations match.
Conditions around the comparison
scroll →- ~2-4% CPU
- Real-time profile CPU
- ~0.5-1% CPU
- Balanced profile CPU
- < 0.05% CPU
- Eco Fan-Only CPU
- 8
- dedicated thermal sensors
What cannot be concluded
The CPU overhead figures carry no hardware baseline, no stated process count, and no container count. The README does not state whether ~2–4% is single-core saturation or aggregate utilization across the CPU complex, and does not confirm the Real-time and Balanced measurements were taken on the same configuration. At the lower bounds of the stated ranges (2% Real-time, 0.5% Balanced), the process-scan ratio becomes 1.95%/0.45% ≈ 4.3×, close to the midpoint result directionally but not numerically equivalent. The qualitative conclusion — process scanning dominates over the thermal loop — holds across the full stated range. The exact multiplier does not.
What this means for Biquadia
Biquadia runs real-time DSP and neural audio enhancement on Apple Silicon, sustaining elevated temperature across the SoC Package, GPU cluster, and ANE sensors throughout a session. Two direct implications follow.
First, MacDashboard’s Real-time profile at ~2–4% CPU is background cost with no stated thread isolation from audio render threads. The README documents no scheduling class or P-core affinity for its monitoring timers. For audio work where buffer underruns are audible, mean CPU percentage matters less than whether monitoring callbacks land on the same cores as the audio graph. Balanced or Eco is the safer default during active Biquadia sessions.
Second, means that once a combined Biquadia-plus-inference session triggers the fan, it runs for the session’s duration. Thermally appropriate — not a defect — but it means the anti-hunting benefit the README advertises is active only at session boundaries. Engineers combining Biquadia with the local LLM pipelines that Wax hybrid recall and Minna’s on-device inference assume should verify that Eco mode — which retains thermal regulation at <0.05% CPU while suspending all process monitoring — is sufficient for their fan control requirements before adopting Real-time monitoring during production audio sessions.
Method: this note was drafted by us.anthropic.claude-sonnet-4-6 from two sources — the published README of PeterTing/mac-tool-kit and this studio’s own published measurements, linked above. Before publication an automated gate re-checked every extracted claim against the source document (25 claim(s) and 14 quantity(ies) verified) and every claim-shaped number in the draft against that evidence (11 derived from it, 18 row(s) supplied from our own tables). The studio has not re-run PeterTing/mac-tool-kit’s benchmarks; figures attributed to it are its own.
FAQ
Does the 7°C spin-down guard reduce fan cycling during local LLM inference?
For short spikes — a single compile or one LLM turn — yes: the guard prevents the fan from stopping immediately after the excursion. For sustained inference at the throughput rates in our decode benchmarks, the chassis does not return to 27.0°C between turns, so the fan runs continuously and the cycling suppression produces no practical effect mid-session.
Is the "90% savings" something MacDashboard produces or something it reports?
The README does not identify the figure's origin, but it matches Anthropic's cache-read pricing discount. MacDashboard reads usage log data and computes cost from token counts; it does not negotiate or generate the discount. The distinction matters when evaluating whether adopting MacDashboard reduces cost or only increases cost visibility.
What does a 10-test suite cover for a tool spanning this many subsystems?
The README states "10/10 tests" run via make test, with no description of what those tests exercise. A tool covering process tree traversal, Docker CLI integration, SMC fan writes, thermal sensor reads, and token cost parsing across multiple AI tools represents many independent failure surfaces. Ten tests is a count, not a coverage claim, and the README makes no coverage claim.
Does fan control work on fanless Apple Silicon configurations?
The README states compatibility with "macOS SMC root helper protocol" and gives an RPM range of 1,200–6,200, implying at least one controllable fan is required. Fanless Apple Silicon configurations are not addressed. Thermal monitoring and process dashboard features may function regardless, but fan speed override requires a fan the SMC can address; the README does not distinguish these cases.
Recommended Studio & Hardware Gear
Affiliate links support independent R&DTested studio equipment and reference hardware utilized for this build. Product images & pricing sourced from Amazon Creators API / SparkFun Electronics.
 $14.98Book
Real-Time Systems
Schedulability Theory: hyperbolic bound, SRP, and response-time analysis R_i = C_i + Σ⌈R_i/T_j⌉ C_j — formulas this scheduler evaluates to predict deadline misses before Gantt draws them.
 $65.05Book
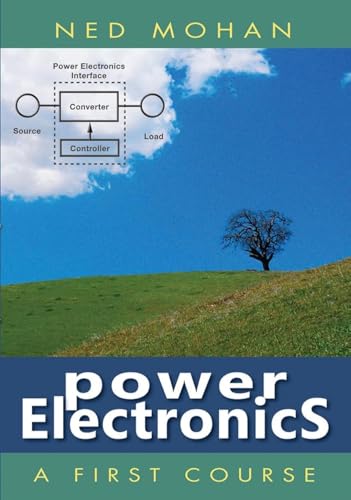
Power Electronics: A First Course
Derives SVPWM V_ref = V_dc/√3, dq transformation, and FOC i_d=0 control — complete theory behind simulator's Park/Clarke, PI current loops, and flux observer.
 $31.63Book
Visual Differential Geometry and Forms: A Mathematical Drama in Five Acts
Sequel to Visual Complex Analysis — explains how conformal warp preserves infinitesimal circles, which you see as grid squares stay square under holomorphic f(z).
![Apple Watch Series 11 [GPS 46mm] Smartwatch with Jet Black Aluminum Case with Black Sport Band - M/L. Sleep Score, Fitness Tracker, Health Monitoring, Always-On Display, Water Resistant](https://m.media-amazon.com/images/I/416RQ0rtsUL._SL500_.jpg) $329.00Wearable
$329.00WearableApple Watch Series 11 [GPS 46mm] Smartwatch with Jet Black Aluminum Case with Black Sport Band - M/L. Sleep Score, Fitness Tracker, Health Monitoring, Always-On Display, Water Resistant
The watchOS target itself. Any on-device inference claim for the Watch is bounded by its CPU-accessible bandwidth, which Apple does not publish.
 $1,179.00Phone
Apple iPhone 17 Pro, US Version, 512GB, eSIM, Silver- Unlocked (Renewed Premium)
The outgoing Pro generation, still the reference iOS device for on-device inference work here. Amazon Renewed unit — Apple no longer sells this model new, which is the same fact that retires its specification page (D-415).
 $1,599.55Computer
13-inch MacBook Air (M5): 32GB Memory, 512GB SSD - Midnight
32 GB of unified memory in the lightest Apple silicon body — enough to keep a quantized mid-size model resident instead of streaming it off SSD.
Prices shown were retrieved from the Amazon Product Advertising API on 20 September 2026 and are indicative only — the price and availability on Amazon at the time of purchase apply.
Prices shown were each checked against the Amazon product listing between 8 August 2026 and 17 September 2026 and are indicative only — the price and availability on Amazon at the time of purchase apply.