Playground · research instrument

On-device AI

Client vs Serverless GPU Benchmarker

Your GPU versus a cloud GPU — measured, never estimated. Run Whisper-tiny-shaped compute workloads on your own device through WebGPU, deploy the provided script to Modal, and race the two. Every bar on the chart comes from a run you executed.

Independent research instrument — not claimed as MakerPortal shipped product code. Methods, equations, assumptions, and limitations are disclosed so you can inspect what the page does and does not establish.

Read the field note →

GPU benchmark

Your device — WebGPU

checking…

Statusidle
Wall time
Sustained
CPU cross-check
Whisper-tiny encoder pass ≥

Naive WGSL kernel (one output per thread; no shared-memory tiling) — treat this as this implementation's floor, not your GPU's ceiling. Derived encoder time is a compute-bound lower bound from the FLOP arithmetic in the Math section.

Serverless GPU — your Modal endpoint

Deploy the script in the Code section, paste the printed bench URL, and set a Modal spend budget first. URL + token live in your localStorage only.

Statusno endpoint
GPU (reported)
VRAM (reported)
End-to-end wall
GPU compute (reported)
Sustained (reported)
SponsorSponsor this simulator. Reach engineering practitioners.
Details ↗

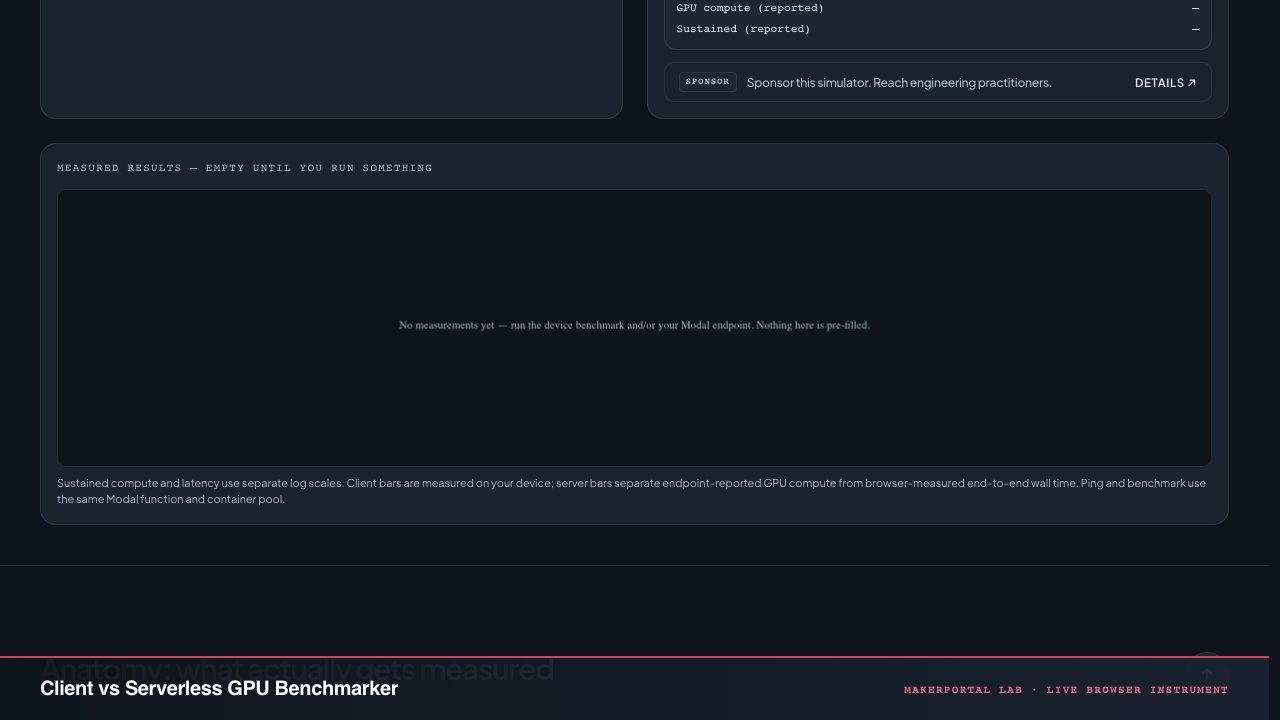
Measured results — empty until you run something

Sustained compute and latency use separate log scales. Client bars are measured on your device; server bars separate endpoint-reported GPU compute from browser-measured end-to-end wall time. Ping and benchmark use the same Modal function and container pool.

Anatomy: what actually gets measured

On-device path

  1. 01

    Adapter request. navigator.gpu.requestAdapter() → device. The badge shows vendor/architecture from adapter.info where the browser exposes it.

  2. 02

    Buffers + WGSL dispatch. A and B matrices fill with deterministic pseudo-random values, upload to storage buffers, and an 8×8-workgroup kernel computes C = A·B. Timing wraps queue.onSubmittedWorkDone(), so it includes real submission + execution, not just JS time.

  3. 03

    Correctness gate. Four output elements are recomputed on the CPU and compared within 0.5% relative tolerance. If the check fails, the run is discarded and reported as failed — a wrong fast kernel is worthless.

Serverless path

  1. 01

    Cold start ping. The first lightweight POST after idle spins up the same GPU function used by the benchmark. Ping again immediately to see the warm number; the difference is the observed scale-from-zero cost for that endpoint.

  2. 02

    Benchmark POST. Your endpoint runs torch.matmul on cuBLAS with explicit cuda.synchronize() fencing and returns GPU name, VRAM, seconds, and TFLOPS. The browser separately measures the full request through response-body wall time. Two clocks, both real, clearly separated in the readout.

  3. 03

    The tradeoff you're staring at. Client: zero network, zero cost, limited VRAM and thermals. Serverless: 24 GB VRAM and cuBLAS throughput, but you pay the round trip (and cold starts) every time the pool scales from zero. This is exactly the decision AuraLinter's verification backend faces — batch codegen checks tolerate cold starts; interactive lint passes don't.

Gear behind this build

Local inference stack · 6 picks

Edge GPUs · accelerators6

More gear across every app: the full Gear list →

Hardware Kit Builder

Reproduce the client-vs-serverless tradeoff on physical hardware before committing to a cloud GPU bill.

Build this lab

Local vs cloud inference bench

Jetson Orin Nano for local GPU inference + Pi 5 as an offload gateway — reproduce the client-vs-serverless tradeoff on real hardware before you commit to a cloud GPU bill.

Prices shown were retrieved from the Amazon Product Advertising API on 19 July 2026 and are indicative only — the price and availability on Amazon at the time of purchase apply.

Prices shown were checked against the Amazon product listing on 9 August 2026 and are indicative only — the price and availability on Amazon at the time of purchase apply.

Estimated total

$695

Prices from Amazon catalog cache · may change

Open primary listing ↗

Kit Total

Buy ↗

The arithmetic, in full

GEMM FLOPs

F=2MKNiters,GFLOPS=F/(109t)F = 2\,M\,K\,N \cdot \text{iters},\qquad \text{GFLOPS} = F / (10^9\, t)

Each output element needs K multiplies + K adds. The attention workload (M=1500, K=N=384) is 0.44 GFLOP per pass; the MLP workload 1.77 GFLOP. t is measured wall time around onSubmittedWorkDone.

Whisper-tiny encoder lower bound

FencL(24Sd2+4S2d),tmin=Fenc/GFLOPSF_{enc} \approx L\,(24\,S\,d^2 + 4\,S^2 d),\quad t_{min} = F_{enc}/\text{GFLOPS}

L=4 layers, S=1500 frames, d=384: QKV + attention output projections cost 8Sd², the two width-4d MLP projections cost 16Sd², and QK^T + attention-value products cost 4S²d. Total: ≈ 35.1 GFLOP per 30 s encoder window, excluding convolutions, normalization, softmax, and elementwise work. Dividing by measured sustained rate gives a compute-bound floor.

Word Error Rate

WER=S+D+INref\text{WER} = \frac{S + D + I}{N_{ref}}

Substitutions, deletions, insertions from Levenshtein alignment over normalized words. Not charted here — this page has no ground-truth transcript, and we do not invent one. Score your own audio via the optional transcribe endpoint.

Offload decision inequality

tremote=trtt+tqueue+F/Rcloud,tlocal=F/Rdevicet_{remote} = t_{rtt} + t_{queue} + F/R_{cloud},\qquad t_{local} = F/R_{device}

Offloading wins when the cloud's throughput advantage outweighs fixed request overhead. With two measured rates R and either a measured warm ping or the benchmark wall-minus-compute overhead, F* = t_fixed · R_device · R_cloud / (R_cloud − R_device) tells you how big a job must be before offload pays for itself. The export records which overhead source it used.

Deploy the serverless side — complete Modal script

modal deploy modal_bench.py prints the bench URL used for both ping and benchmark requests. Modal's Starter plan currently includes monthly compute credit, but a payment method is required; review current pricing and set a workspace budget before deploying. The commented block adds a real Whisper-large-v3 transcription endpoint. Create a Modal account ↗

# modal_bench.py — deploy: pip install modal && modal deploy modal_bench.py
# Starter credits can cover short runs; review current pricing and set a spend budget.
import time
import modal

app = modal.App("mp-gpu-bench")
image = modal.Image.debian_slim().pip_install("torch", "numpy", "fastapi[standard]")

@app.function(image=image, gpu="A10G", timeout=120)
@modal.fastapi_endpoint(method="POST")
def bench(req: dict):
    if req.get("ping"):
        return {"ok": True, "t": time.time()}  # same GPU container pool as the bench
    import torch
    size = int(req.get("size", 2048))
    iters = int(req.get("iters", 20))
    dev = torch.device("cuda")
    a = torch.randn(size, size, device=dev)
    b = torch.randn(size, size, device=dev)
    torch.cuda.synchronize()
    for _ in range(3):
        (a @ b)
    torch.cuda.synchronize()
    t0 = time.perf_counter()
    for _ in range(iters):
        c = a @ b
    torch.cuda.synchronize()
    dt = time.perf_counter() - t0
    flops = 2 * size**3 * iters
    return {
        "gpu": torch.cuda.get_device_name(0),
        "vram_gb": round(torch.cuda.get_device_properties(0).total_memory / 1e9, 1),
        "size": size, "iters": iters,
        "seconds": round(dt, 4),
        "tflops": round(flops / dt / 1e12, 2),
        "checksum": float(c[0, 0]),   # proves the multiply actually ran
    }

# Optional: real Whisper-large-v3 transcription endpoint (adds ~3 GB image):
#   image2 = image.pip_install("openai-whisper")
#   @app.function(image=image2, gpu="A10G", timeout=300)
#   @modal.fastapi_endpoint(method="POST")
#   def transcribe(req: dict):
#       import base64, tempfile, whisper
#       model = whisper.load_model("large-v3")
#       with tempfile.NamedTemporaryFile(suffix=".wav") as f:
#           f.write(base64.b64decode(req["wav_b64"])); f.flush()
#           t0 = time.perf_counter()
#           out = model.transcribe(f.name)
#       return {"text": out["text"], "seconds": time.perf_counter() - t0}

Export · Soft gate

Export your benchmark report

Everything you measured this session — device GFLOPS with verification status, endpoint timings, RTT, and the computed offload crossover F* — as JSON for your infra decision doc.

File · gpu-benchmark-report.json

gpu-benchmark-report.jsonapplication/json+ watermark line on free path

Free download adds a small footer: /* Export from makerportal.ai — free watermarked build. Unlock …Clean export removes footer. Both are generated fresh from your current sim tuning.

Privacy: email stays in your browser localStorage (mp_export_email_modal-gpu-benchmarker) + unlock flag (mp_export_unlock_modal-gpu-benchmarker). If Buttondown username is configured, we also POST to Buttondown (privacy-first mode, no tracking pixels per D-014). See privacy → affiliates & email.

Unlock clean export

Soft gate — no hard paywall, no Clerk. Email stays local unless you explicitly check the newsletter box. Unsubscribe anytime. RSS at /rss.xml.

Export → Fab bonusAfter export, your tuned stackup can be ordered via PCBWay/JLCPCB CTA (when live) — see /privacy#affiliates for live merchants.

Frequently asked questions

Where do the numbers on the chart come from?

Two places only: (1) WebGPU compute passes executed on your device right now, timed around queue.onSubmittedWorkDone() and verified against a CPU reference before being reported; (2) JSON returned by a Modal endpoint that you deployed yourself with the script on this page, plus the wall-clock round-trip your browser measured. There is no third source. If you have not run a benchmark, the chart is empty — this page never shows invented performance data.

Why matrix multiplies instead of running actual Whisper in the browser?

Transformer inference time is dominated by GEMMs. The workloads here use Whisper-tiny’s real encoder dimensions (d_model 384, MLP 1536, 1500 mel frames), so the measured sustained GFLOPS is representative of the compute your device could bring to that model — without downloading 40 MB of weights or an ONNX runtime. The Math section shows the exact FLOP arithmetic that connects the two, and labels the derived per-pass time as a compute-bound lower bound.

Is there a shared Modal API key I can use?

No. Shipping a shared key in a static site would expose it to abuse within hours. The trade we chose: a complete, copy-paste Modal script you deploy in your own workspace after reviewing pricing and setting a spend budget. Your endpoint URL and optional auth token stay in localStorage — this site has no backend and never sees them.

What is the naive-kernel caveat on the WebGPU number?

The WGSL kernel is a straightforward naive matmul — one output element per thread, with no subgroup operations or workgroup-shared-memory tiling. Optimized kernels can run materially faster on the same hardware, so treat the on-device number as a floor for this implementation, not a device-wide ceiling. The serverless side reports torch.matmul on cuBLAS — an intentionally asymmetric but honestly labeled comparison.

How would I score transcription accuracy (WER)?

Word Error Rate = (substitutions + deletions + insertions) / reference words, via Levenshtein alignment on normalized text. The Modal script includes an optional Whisper-large-v3 endpoint; run the same audio through a local whisper-tiny and the endpoint, then score both against a reference transcript. We do not display WER here because this page has no ground-truth transcript to score against — the formula is in the Math section.

Shareable still

The instrument, captured—not illustrated.

This 16:9 frame is rendered from the real browser instrument above. It is the page's canonical preview for image search, link unfurls, and posts that need to show what the tool actually does.

Download 1280 × 720 JPEG
Client vs Serverless GPU Benchmarker — live MakerPortal instrument screenshot
Canonical capture · real UI · no generated scientific artwork